
In creating Hunter’s Curve, the beauty of what Dr. Roy Hunter did was to take an incredibly complex problem in probability theory and make it simple — so simple, in fact, that all it required was basic arithmetic. The complexity involved a “mixed system” combining the calculation of instantaneous demand in a water distribution system with fixture types that differ from each other in frequency of use and flow rate. The solution resulted in a fixture list with unique unit values (fixture units) and a design curve predicting the 99th percentile flow rate for each fixture unit value. In order to properly size the pipes in a domestic water (i.e. potable water) piping system, each plumbing fixture (e.g. toilet, sink, shower, etc.) had an assigned value, known as the fixture unit (specifically, the water supply fixture unit). All the plumbing system engineer or designer needed to do was count the number of each type of plumbing fixture inside a building or area inside the building, multiply by each plumbing fixture’s “fixture unit” value and total the fixture units. From there, referencing the “Hunter’s Curve” chart would lead to a given instantaneous peak flow rate. Referring to Table 1.1 and Figure 1.1 you can see an example of this process.

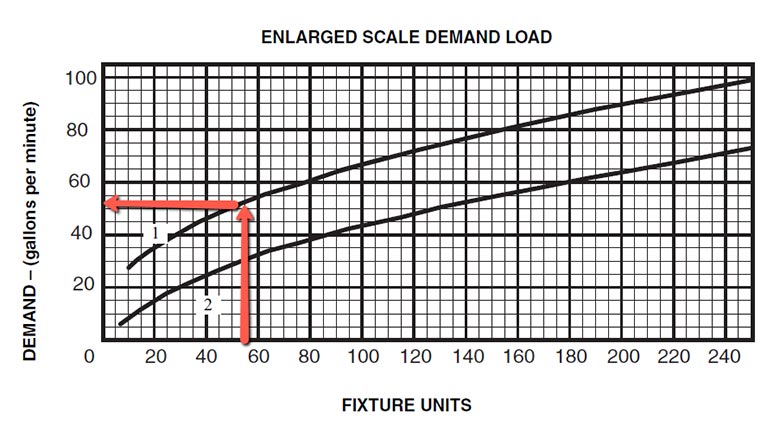
As a point of comparison, if you assumed the 100th percentile flow (i.e. everything on simultaneously) in lieu of 99th percentile, the calculated peak flow rate would approach 250 gpm (assuming 25 gpm per flushometer, and 0.5 gpm per lavatory). By utilizing an elegant probability model, Hunter’s Curve had immense benefits outside of reduced construction costs; most notably, a drastic reduction in the time it took engineers to design plumbing systems. In fact, the simplification was so drastic that many mechanical engineers delegated the design of plumbing systems to “drafters” — that is the folks who would hand draw engineering plans via direction from an engineer.
The model plumbing codes are incredibly detailed in the instructions on how to size plumbing systems, which in essence “encourages” the design professional to follow the Hunter Curve methodology. Building codes, including the plumbing code, are considered the minimum standard of design. Deviating from code exposes the engineer to much liability — if the engineer doesn’t follow this methodology and reduces the size, and the system doesn’t work, they would have to pay an especially high amount in damages (and potentially lose their professional engineering license). This would be an increase in damage paid due to deviating from the code; rather than being less severe “negligent” damages that would be paid, the damages would be higher “punitive” ones.
Additionally, most design professionals work for projects via “lump sums” rather than “time and materials.” Another way to put this is that engineering firms estimate how much time a project will take and give their client a proposal for that time, rather than charging “by the hour” for a project. By estimating how much effort will be required for a project prior to starting the process, the challenge for the engineer is to budget their time in such a manner that the project is completed in a timely manner. Thus, the financial incentive for engineering firms is to find the most efficient way of completing projects (rather than finding the best solution for the owner).
Therefore, the plumbing design professional has two incentives pushing them: (1) the avoidance of incurring risk on a project and having something go wrong and (2) finding the fastest way to complete the project. Both of these motivators mean that code is almost always followed closely. New concepts, materials, devices or innovations are generally not encouraged because they would both increase the risk to the engineer and take more time to implement due to the added time (or cost) for the engineer to research or develop the concept. Because of these factors, the MEP engineer, via their plumbing engineer, will default to just utilizing Hunter’s Curve, as it has been adopted by codes for numerous years and streamlines the process of engineering plumbing systems. Unfortunately for plumbing systems (and our health), a lot has changed since 1940.
Saving water
Reading through Dr. Hunter’s work (BMS65 report) from 1940, toilets used about 4 gallons per flush (gpf). (Remember that the toilet was the base unit used for the development of Hunter’s Curve). For more than 40 years, 4 gpf for a toilet was the standard volume of water all plumbing and civil engineering utilized to size water and waste piping systems for buildings and municipalities. Sewer systems and sanitary and waste piping inside buildings were sized to accommodate these flow volumes.
Then, in the 1980s, there was an initial push to reduce flow rates of various plumbing fixtures. This effort was intended to help save water, but more in line to standardize plumbing fixture volumes.
In August of 1998, the Leadership in Energy and Environmental Design version 1 (LEED V1) was released by the U.S. Green Building Council (USGBC). This was the culmination of five years of work led by senior scientist and environmentalist Robert K. Watson from Chicago, who spearheaded a consensus group of nonprofit organizations, government agencies, architects, engineers, developers, builders, product manufacturers and other industry leaders. Since then, the standard has undergone multiple revisions, with the latest, version 4.1, being utilized at the time of this writing. USGBC stated the following with regard to the purpose of LEED: “Our vision is that buildings and communities will regenerate and sustain the health and vitality of all life within a generation. Our mission is to transform the way buildings and communities are designed, built and operated, enabling an environmentally and socially responsible, healthy and prosperous environment that improves the quality of life.” A focus on energy sustainability and buildings that keep people healthy were the founding principles.
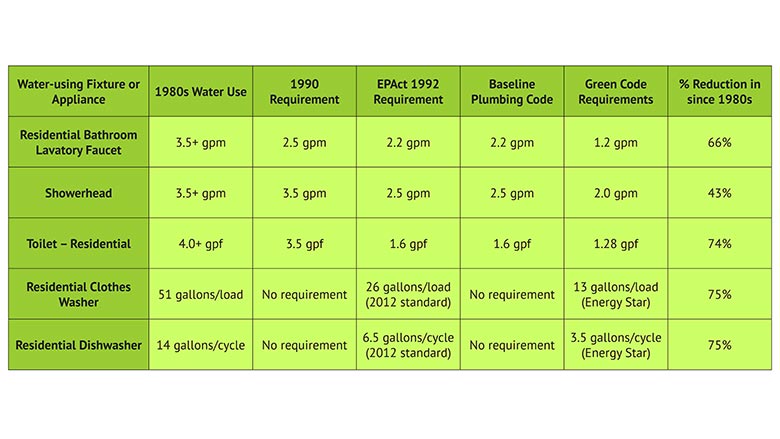
One of the specific environmental challenges that LEED v1 wanted to help solve was the usage of freshwater inside commercial buildings. In LEED v1, the first initiatives aimed at further reducing the flow of water. Reducing water usage by volume further, subsequent LEED versions continued to drive toward less and less water usage in buildings and was supplemented by the U.S. EPA’s WaterSense program in 2006, which worked with LEED to reduce water flow rates further. These subsequent drives for less water usage have led to the advent of dual flush toilets (1.1/1.6 gallons per flush), low flow toilets (1.28 gallons per flush), waterless urinals (0 gallons per flush), low-flow faucets (0.35 gallon per minute), and low-flow showers (1.5 gallons per minute).
Considering that we are seeing more and more water shortages across the United States, at first glance, most would celebrate this trend. From 1940 to 2020, the water used by a toilet was reduced to less than 15% of its original value — an almost 700% decrease. While water conservation is of vital importance, especially in the water-starved Western United States, there are a number of unintended consequences that can occur from lowering flow rates without changing other practices.

")

