
In order to understand the influence professionals have in specifying, recommending, purchasing and/or installing specific categories of plumbing products, RJ 2.0 surveyed its west-coast readers in November 2018. The purpose of this study is to better understand the sales/installation of solar thermal, geothermal, hydronic heating, high-efficiency/sustainable plumbing and smart plumbing equipment and products.
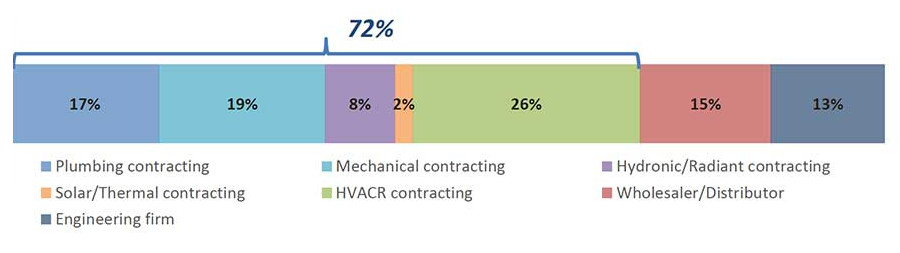
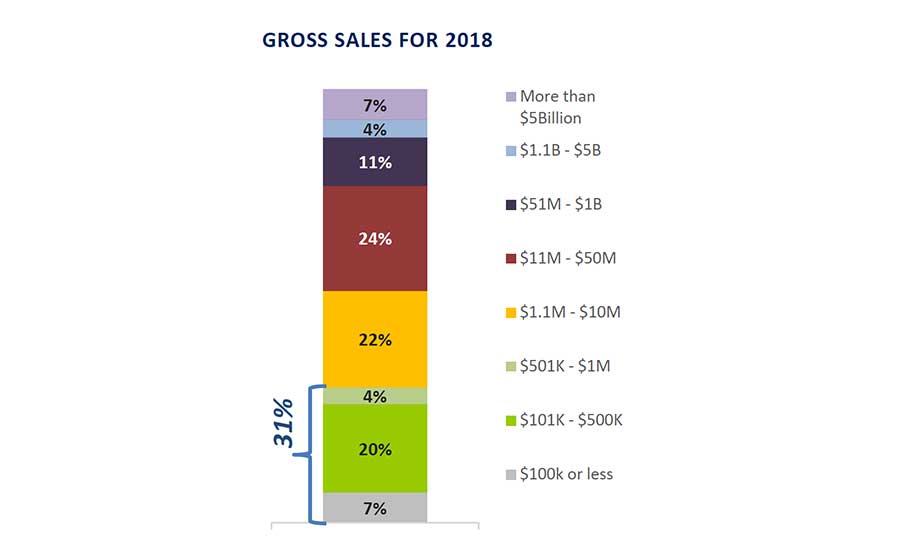
Respondents were primarily contracting firms, with more than half in management positions, as shown in Figure 1. Over two-thirds of the firms report sales of more than $1M for 2018, and more than 60% estimate this will be an increase over 2017. Almost half of the plumbing projects reported are residential, and of those, a majority are repairs/ remodels.
> Figure 1
> Figure 2
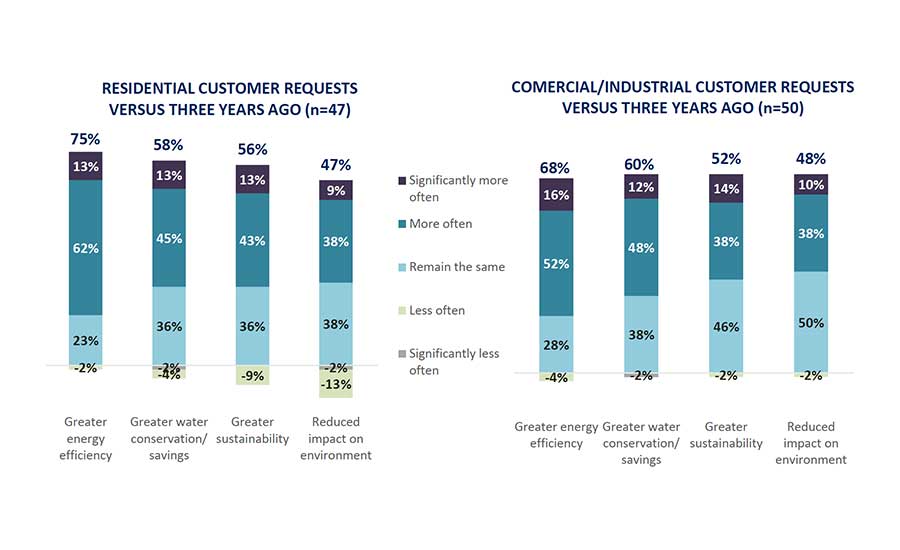
Three-quarters of residential customers are asking about energy efficiency more often than three years ago, according to Figure 3. In addition, a majority of commercial customers are asking more frequently about energy efficiency, water savings and sustainability. In comparison to 3 years ago, residential and commercial customers are also asking about water conservation, sustainability and reduced impact on the environment more often.
> Figure 3
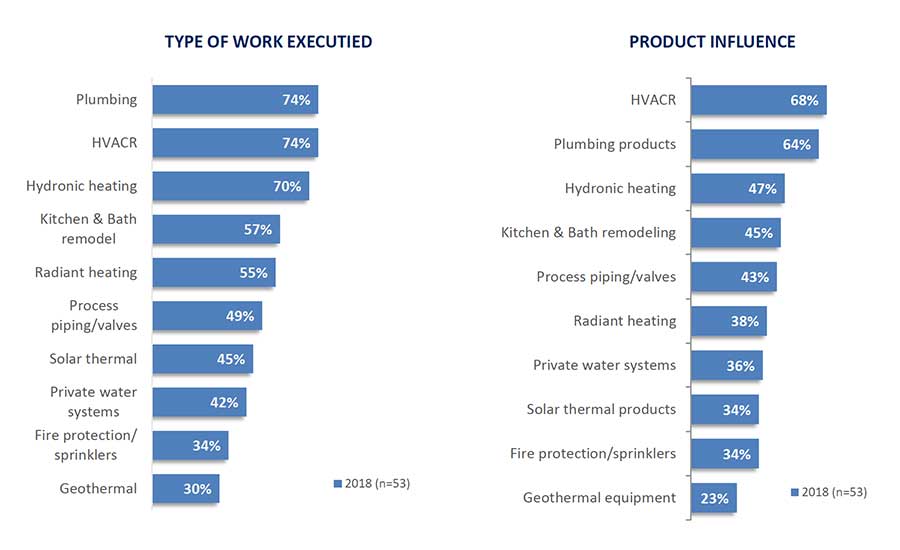
The most common projects are plumbing, HVACR and hydronic heating, along with the highest level of influence on product selection and/or installation. Figure 4 shows how those surveyed answered when asked, “Which of the following types of products do you currently specify, recommend, purchase and/or install?” Each response is out of 100% as the respondents were asked to check all that applied.
> Figure 4
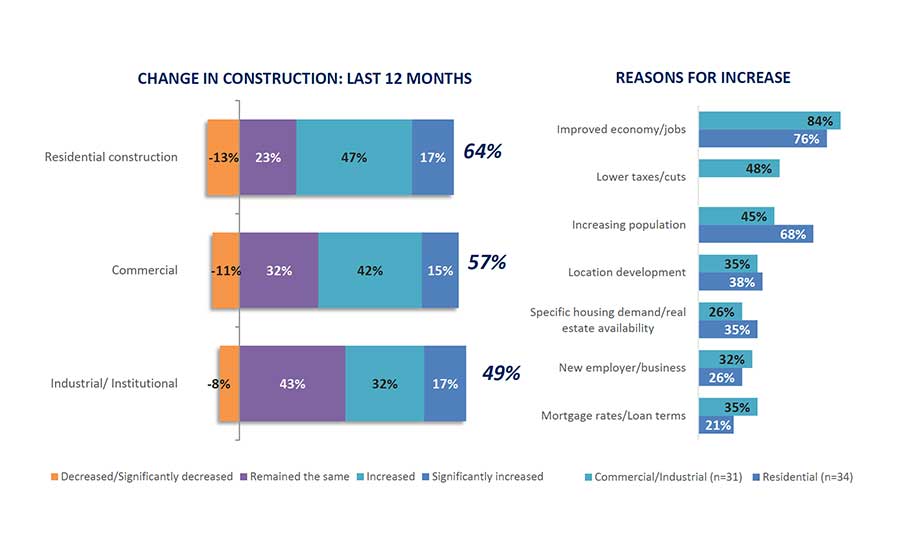
The number of construction projects in the last 12 months are increasing, as Figure 5 notes, especially for residential construction, predominately believed to be due to the improved economy. Other reasons include: Lower taxes/cuts, mortgage rates/loan terms, new employer/business, specific housing demand/real estate availability, location development and increasing population. While still optimistic, respondents were fairly split that the next twelve months will either maintain the same level of business, or continue to increase.
> Figure 5
What’s trending
Finding and keeping qualified labor is an issue for 70% of respondents, with a belief that most of the younger generation has a lack of interest in the trades. Other reasons finding/keeping qualified labor was an issue for respondents include: Lack of advancement opportunities, can’t pass a drug test, manual labor is “too hard,” perception of lower pay, lack of vocational training, lack of certified professionals and a labor shortage in the area in which they work.
Aside from labor shortage, when asked for their comments and opinions on any future trends they foresee regarding the plumbing-mechanical industry, respondents listed smart products/innovation, efficiency/green issues, market growth/demand and informed end-users.
> Figure 6
Involvement in solar thermal products continues to increase, up significantly over the last five years. Most projects are residential and domestic water heating only. Slightly more than half of respondents report that requests for thermal products are up this year, with similar expectations for next year.
Respondents indicated that they personally specify, recommend, purchase and/or install the following products for solar thermal projects most often: Water heaters (backup), heat exchanger, circulating pumps, solar storage tanks and isolation valves. Other products include: controls, solar collectors, collector mounting systems, tankless water heaters (backup) and tempering valves.
Nearly a third of firms were involved with geothermal projects versus last year, with almost half being for space heating only. Requests for geothermal products are trending up, although not significantly versus last year. Expectations for the next five years are mixed.
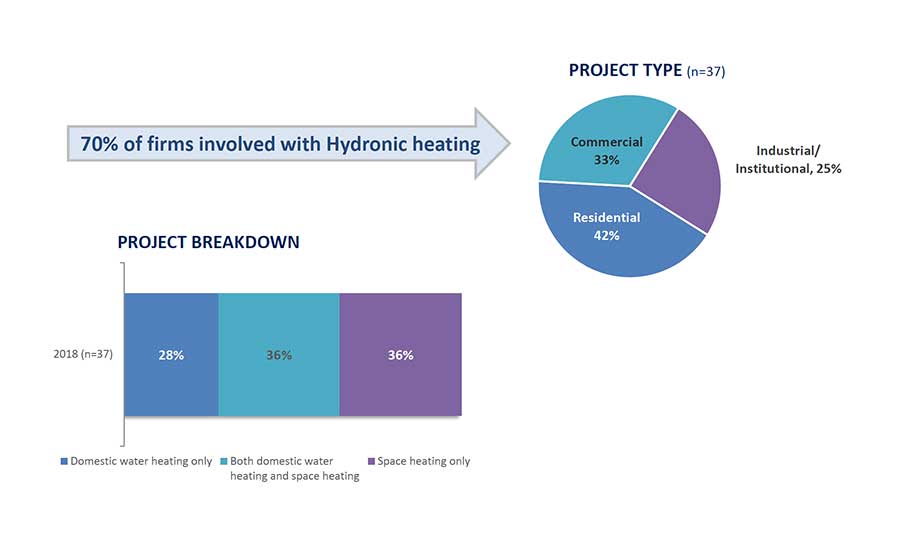
Almost three-quarters of firms report involvement in hydronic heating projects versus last year, with a good mix of residential, commercial and industrial applications. Half of respondents reported requests for hydronic products on par with last year, with similar expectations for the next five years.
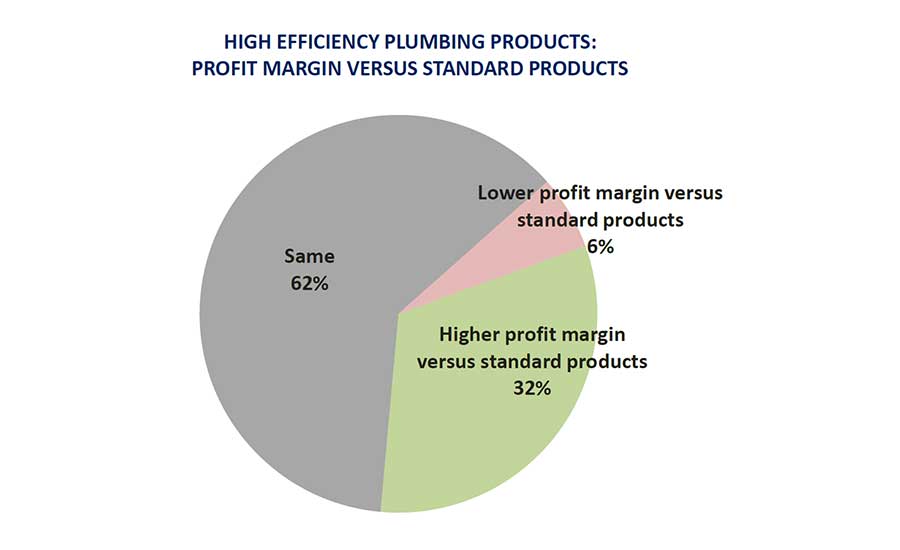
> Figure 7
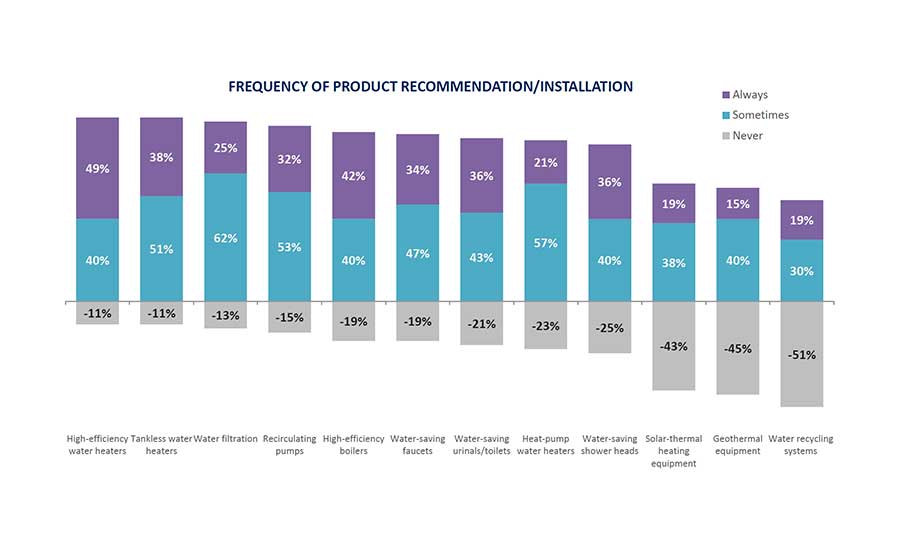
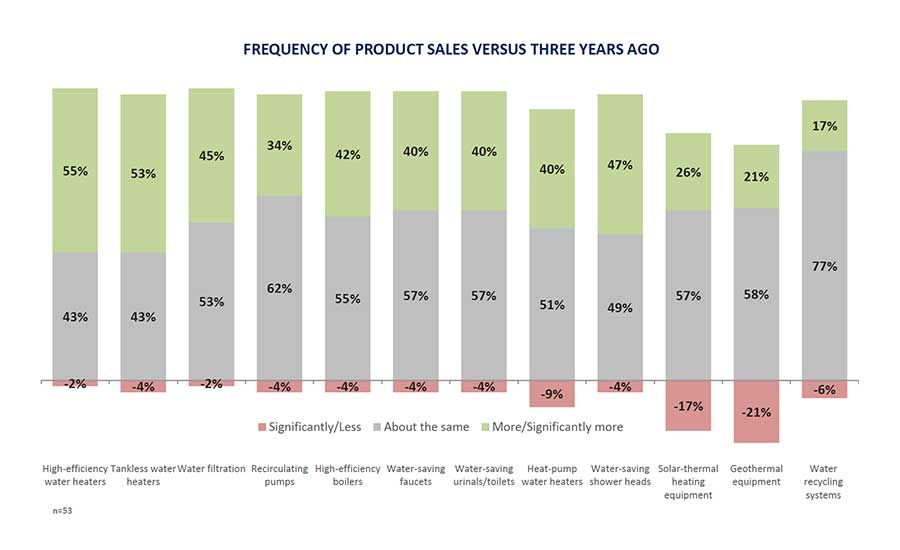
The most commonly recommended/installed high-efficiency products are water heaters (49% always), boilers (42%), tankless water heaters (38%), shower heads and urinals/toilets (36%). Energy-efficient products with the greatest increased sales versus three years ago were water heaters, followed by showerheads. Figures 7 and 8 show the breakdown. Overall, green products are perceived as either slightly more profitable, or on par with standard plumbing products. Less than 10% feel green products are less profitable.
> Figure 8
Distributors, sales representatives, manufacturer websites, and peers/colleagues are the most commonly used sources of information for energy-efficient products.
While there is still some traditional marketing, most contracting companies report also marketing through multiple digital channels. Sixty-six percent advertise through a company website, 40% use Facebook as a tool and 36% use LinkedIn. Respondents also listed referrals/word of mouth, radio ads, Twitter, yellow pages, print ads, direct mail, billboards, Instagram and Snapchat as marketing tools.
Demographics
Respondents of this survey are 88% male and 12% female. Eight percent are 70 years old and above, 9% are between ages 60 to 69, 28% are 50 to 59, 15% are 40 to 49, 36% are 30 to 39 and 4% are 18 to 29. In regards to experience in the industry, 4% have above 50 years, 13% have 41 to 50, 15% have 31 to 40, 13% have 21 to 30, 32% have 11 to 20, 21% have 4 to 10 and 2% have 1 to 3 years’ experience.
> Figure 9
In terms of company size, 6% of respondents belong to a company that has more than 5,000 employees, 8% have 1,001 to 5,000, 6% have 501 to 1,000, 12% have 101 to 500, 21% have 51 to 100, 12% have 21 to 50, 15% have 6 to 20 and 21% have 5 employees or less.
In regards to annual revenue, 7% of respondents report the company he/she works for makes $5 trillion a year, 4% make $1.1 to $5 trillion, 11% make $50.1 million to $1 trillion, 24% make $10.1to $50 million, 22% make $1.1 to $10 million, 4% make $501,000 to $1 million, 20% make $101,000 to $500,000 and 7% make $100,000 or less. RJ 2.0


