
In 2012, the International Association of Plumbing and Mechanical Officials (IAPMO), the University of Cincinnati (U of C), and the American Society of Plumbing Engineers (ASPE) began to work on a new sizing technique 80 years in the making. The main drivers were Dan Cole (IAPMO) and Steve Buchberger (U of C), and later Toju Omaghomi (U of C). As part of this effort, hundreds of thousands of data points were taken and evaluated to determine actual human behavior and plumbing fixture use in residential homes.
The data was evaluated and a new calculation tool was developed. This method was ultimately dubbed “The Water Demand Calculator” (WDC), and the WDC was ultimately added to the 2018 UPC as “Appendix M.” This marked the first time in almost 80 years that an alternative to Hunter’s Curve pipe sizing methodology was added to a model code.
The benefits were quickly apparent as identified. Many, if not all, of the issues due to oversized water piping I previously mentioned, are solved by the WDC and the right sizing of these piping systems produced:
- Up to 16% cost savings on piping materials;
- Improved water quality by reducing water dwell times;
- Faster hot water delivery and improved energy efficiency; and
- Improvements in water conservation by reducing water volumes in piping systems.
At the time of this writing, the Water Demand Calculator is meant to be applied to residential buildings, either single or multi-family (such as a high-rise condo/apartment), only. Offices, hospitals, schools, restaurants and other non-residential commercial buildings still need evaluation. However, in 2021, IAPMO and U of C initiated the next phase of the WDC which includes incorporating sizing for these other building types.
What is especially noteworthy about the WDC is its ability to balance the need for water conservation and the need for water safety. It truly is a holistic solution. In the plumbing industry at times, solutions are presented that solved one problem but create others. The WDC may be one of the few instances where negative consequences are eliminated instead of increased.
The Water Demand Calculator is continuing its development process, entering the next phases of the project. Recently, IAPMO expanded the task force into a task group, increasing volunteer grouping from five people to almost 40. Every week and month, more and more volunteers are joining this revolutionary movement. The Task Group is beginning to receive more and more data getting closer to breakthroughs in multiple commercial building types. Momentum is on our side. The Water Demand Calculator is the market disruptor that plumbing industry professionals want to be a part of. As a result, many water issues may be solved in the built environment. But even more water conservation is needed.
The Perato Principle and water saving
In business, there is a principle known as the Perato Principle. This principle states that “for many events, roughly 80% of the effects come from 20% of the causes.” In his book, “The 80/20 Principle,” Richard Koch talks about how one can observe this in business in multiple ways:
- 80% of most companies’ revenue comes from just 20% of their clients;
- 80% of a company’s work is completed by 20% of their staff; and
- 80% of return on sales comes from 20% of projects;
In this book (and its subsequent editions) Mr. Koch shows a multitude of examples and case studies that show this principle to be true. But what if we take this principle and apply it to water? Can we determine what water-saving measures would have the greatest impact on our overall water usage by applying the 80/20 rule? It turns out that yes we can.
In reviewing the yearly EPA reports on freshwater usage, we find in Figure 1 below.
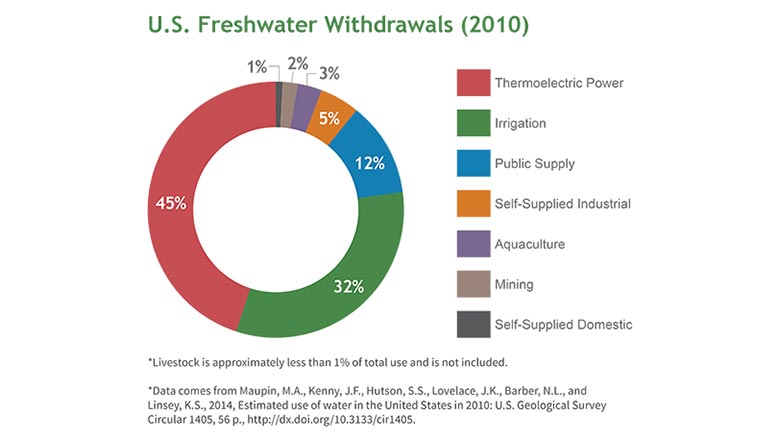
What becomes readily apparent is that two (out of seven) uses of water (~20% of all uses) account for almost 80% of all water usage: (1) thermoelectric power and (2) irrigation (farming). The next biggest user of water is public supply, which includes industrial buildings, commercial buildings and residences. Industrial buildings (think manufacturing) most likely make up the majority of public water use, followed by commercial and residential buildings. It is likely that the water conservation efforts we have been focusing on as a society make up around 5% of all freshwater uses.
There’s a pretty glaring argument in there: Why are we not focusing on the two much bigger drivers of water usage? Thermoelectric power and irrigation (farming account for the vast majority of water withdrawals in the United States (77%). Why not follow the Pareto Principle and focus on the 20% of water uses that account for 80% of water usage?
The answers lay in two parts — the water energy nexus and smarter irrigation. But more on that in my next column.
Editor’s Note: This column is part of a series. Catch up with Part 1, Part 2 and Part 3.

")

