The use of hydrant flow testing data to design automatic sprinkler systems has gotten easier thanks to new computer modeling software.
Hydrant flow testing data provides important information for designing an automatic sprinkler system. In this article, we will look at how the data is gathered at the Insurance Services Office (ISO)1.
Computer models that can accurately simulate the flow of water in sophisticated water supply systems are replacing slide rules and handheld calculators. We will examine here how computer models are calibrated using data from hydrant flow tests.

We'll also look at hydrant flow testing based on theories of fluid mechanics that were developed by brilliant scientists who lived and worked during the 1700s.
Flow testing has traditionally been a soaking wet and dirty, labor-intensive activity using paper and pencil to record data from handheld gages. We will look at how new computer software and other new technologies are affecting hydrant flow testing.
Why Fire Hydrants Are Tested
Fire hydrants are designed as an integral part of public and private water supply networks. Hydrants are not to be located on mains smaller than 6" in diameter, and should be connected to the main by a short run of 6-in. diameter pipe controlled by a gate valve. Hydrants must be tested on a regular basis to ensure that they are capable of delivering water at a pressure and a rate of flow for public health and effective firefighting operations. A water pressure of 20 psi is considered the minimum required for effective firefighting operations and preventing the contamination of public water supplies by backflow.
Major Thomas Adams once tested a hydrant at Keesler AFB in Mississippi and experienced what might possibly be considered a firefighter's worst nightmare. There was no water flowing from the hydrant. It so happened that the hydrant in question was "at the end of a dead-end branch line and hydrants were being flushed upstream."
Fire Ground Hydraulics
Firefighting efforts can be seriously jeopardized if the pressure and flow at a required hydrant drops below safe levels. Even large fire engines are seldom equipped to carry more than 2,000 gallons of water. That would only provide a few minutes of firefighting capability. Firefighters at the scene of a raging fire rely on the nearest fire hydrant as their main source of additional water available. Fire hoses must route the water from hydrants to the suction side of the pumper on a fire truck. The water is then pumped to attack hoses directed at the fire.
The pump operator determines the pressure drop in the hydrant by comparing the difference between the static and residual pressure. The smaller the pressure drop, relative to the static pressure, the greater will be the amount of additional water available for effective firefighting operations.
Fire Sprinkler Systems
The design of automatic fire sprinkler systems is largely dictated by the data from hydrant flow tests. A fire sprinkler hydraulic calculation is a system of accounting that balances demand and supply. The demand is imposed by the pressure and flow requirements of the fire sprinkler system. The supply depends on the available pressure and flow as measured by the hydrant flow test. If the demand imposed by the sprinkler system exceeds what the supply is capable of providing, the design must be adjusted to achieve equilibrium between demand and supply. Pipe sizes may have to be increased to reduce friction losses, or fire pumps may have to be installed to boost the pressure and flow as measured by the hydrant flow test. The fire sprinkler design is closely tied to the data from a hydrant flow test.
Equation 1
Water Distribution Modeling
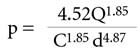
A new technology used in sprinkler system design is water distribution modeling. The data obtained from hydrant flow tests is used for calibrating computerized models of water supply based on the Hazen-Williams method of estimating head loss from friction in water pipes. The Hazen-Williams equation is expressed in Equation 1.
Where:
p = friction loss (psi/ft)
Q = flow (gpm)
C = Hazen-Williams C-Factor (dimensionless)
d = pipe diameter (ins)
Equation 2
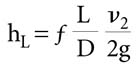
The elegant simplicity of the Hazen-Williams equation makes it preferable to the Darcy-Weishbach method for estimating the head loss used in Equation 2.
The Darcy-Weisbach method is based on a determination of the Moody friction factor (f). The Moody f is a function of kinematic viscosity, relative roughness and the Reynolds Number. While this method includes the effects of turbulence at high flow velocities, it is much more complicated to use than the Hazen-Williams equation.
Equation 3
Fluid Mechanics and Hydrant Flow Testing
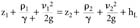
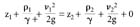
The main equation of flow is based on the one published by Daniel Bernoulli (1700-1782) in his book Hydrodynamica in 1738. The Bernoulli equation is used to analyze fluid flow along a streamline from location 1 to location 2 and is presented in Equation 3.
Where:
z1 and z2 are the elevations (ft) at locations 1 and 2.
r1 and r2 are the pressures (lbs/ft2) at locations 1 and 2.
g is the specific density of water (62.4 lbs/ft3).
n1 and n2 are the velocities (ft/sec) at locations 1 and 2.
g is the constant of gravitational acceleration (32.2 ft/sec2).
hL is the head loss due to friction (ft).
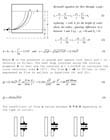
Figure 1. Deriving the Equation of Flow.
In the Bernoulli equation, fluid flow occurs in response to differences in pressure between two points in a flow stream. Since our experience and intuition often confirms that water tends to flow downhill, the difference in elevation z (ft), between two points in the flow stream is the first component. The fluid column pressure r (lbs/ft2) is the second component. It is divided by the specific weight of the fluid g (62.4 lbs/ft3) to make it consistent with the linear units used in expressing the elevation component. The sum of the two is referred to as the piezometric head. The third component in the Bernoulli equation is velocity pressure n2/2g. The sum of the three components, the total head available to the fluid, is called the energy grade line.
Equation 4
Velocity Pressure and the Flow Equation
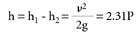
We will use a modified Bernoulli equation to derive the equation for estimating the flow from a fire hydrant. We begin by writing the Bernoulli equation between the water surface located at 1 and the orifice located at 2. The procedure used for deriving the equation of flow for a hydrant is similar to one used to determine the flow from an orifice of diameter D ft located at a depth of h ft below the water surface in the water container shown in Figure 1. We then replace z with h, and since the water in Figure 1 does not flow through any piping, the pipe length L equals 0 and hL = 0, as shown in Equation 4.
Equation 5
Since pitot gages are normally calibrated in pounds per square inch (psi), we need to express the velocity pressure measured in feet of head h in terms of P in pounds per square inch. This relationship, expressed in Equation 5, is known as Toricelli's Law.
As detailed in Figure 1, the flow equation is derived by expressing Q as a function of pitot pressure P (psi) and hydrant diameter D (in) in Equation 6.
Q = c 29.83√P x D²
The discharge coefficient c varies with the type of outlet on the hydrant. In most modern hydrants, the transition between the vertical barrel of the hydrant and the horizontal outlet tends to be smooth and rounded. The operator must feel the inside contour of the hydrant outlet and compare it to the three types of outlets shown in Figure 1 to estimate a discharge coefficient, e.g., the outlet on the left projects into the barrel of the hydrant with a discharge of 0.7. The one on the right has a smooth contour with a discharge coefficient of 0.9.
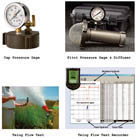
Figure 2. Hydrant flow testing equipment, including the Cap Pressure Gage, Telog Flow Test, Pitot Pressure Gage & Diffuser and Telog Flow Test Recorder.
How Fire Hydrants Are Tested
The American Water Works Association (AWWA)3 and the National Fire Protection Association (NFPA)4 have published guidelines for hydrant flow testing. While old and time-tested procedures still hold sway, newer gadgets are appearing on the horizon. A hydrant flow test is primarily concerned with the measurement of static pressure and pitot pressure at a hydrant located in the field. The required flow test gages are shown in Figure 2.
Test Hydrants and Flow Hydrants
A flow test usually involves two fire hydrants. The first one is called the test hydrant or residual hydrant. The second one is called the flow hydrant. A test proceeds as follows:
-
The cap covering one of the hydrant outlets is unscrewed and replaced with one equipped with a pressure gage. The valve on the test hydrant is opened, allowing water under pressure into the hydrant. The pressure is referred to as the static pressure. This represents the water pressure in the water main as measured at the elevation of the hydrant outlet.
-
One or more caps on the flow hydrant are opened and the inside diameter of each outlet is measured and recorded. The flow hydrant valve is then fully opened to create a steady flow of water from the outlet. In some cases, the resulting horizontal geyser may be sufficiently disruptive to justify street closures.
-
A pitot gage is used to measure the velocity pressure of the stream issuing from the hydrant. While the pitot pressure is being recorded, a second pressure reading is taken at the test hydrant. This is called the residual pressure. The residual pressure records both the domestic and fire flows occurring in the water main.
-
The final step in the flow test involves shutting down the flow hydrant and taking another static pressure reading as a check on the previous reading. The two readings must be similar. If the second reading is higher, it may be due to a pump automatically starting to meet the demand imposed by the flow test. In that case, the flow test must be repeated after shutting down the pump. There are good reasons to double-check the static pressure. If the second static pressure reading falls very far below the first one recorded, it's possible that a water main broke during the test. The pitot pressure reading P (psi), the hydrant diameter D (in) and the hydrant coefficient c from Figure 1 can then be used to calculate Q (gpm) using Equation 6.
Electronic Flow Meters
The Telog HPR-31 fire flow-testing unit is an electronic recording device connected to a Palm Data Transfer Unit, which allows hydrant flow tests to be performed and completed by a single operator, as shown in Figure 2. The unit generates a graph of the pressure and flow profile as a function of time. When the flow hydrant is opened, the residual graph records a precipitous drop in pressure (psi) matched by an equally sharp rise in the flow graph (gpm). The static and residual pressures are also chronologically tabulated. The HPR-31 may be installed on the 2-1/2-in. hydrant nozzle of a standard fire hydrant. The unit may also be connected to a laptop using a watertight RS-232 connector and serial interface cable.5 Electronic testers save labor and time. However, they carry a hefty price tag ($1,397, compared to $600 for traditional kits) and must be regularly calibrated to verify their accuracy.
Technology is no substitute for skill and common sense. Care must be taken to avoid property damage. Only trained and experienced field personnel should be allowed to conduct flow tests.
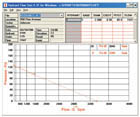
Figure 3. Flow testing software.
Hydrant Flow Testing Software
Hydrant Flow Test 4.31 for Windows6, displayed in Figure 3, is a software application for processing and presenting hydrant flow test data. The flow test results are depicted on graphs with a vertical axis scaled in arithmetic units and the horizontal axis in logarithmic units. The static pressure (psi) is plotted as a point on the vertical axis corresponding to a flow of 0 gpm on the graph. The residual pressure is plotted as a point on the vertical axis that corresponds to the discharge from the flowing hydrant. A static pressure of 125 psi and residual pressure of 95 psi were entered into the relevant fields on the upper left side of the screen, which represents the test hydrant. The hydrant diameter of 2-1/2", a hydrant coefficient of 0.9 and pitot pressure of 85 psi were entered in the first row of the spreadsheet on the right side of the screen, which represents the flow hydrant. The resulting flow of 1,547 gpm was calculated and a graph drawn below the spreadsheet.
Equation 7
We can check the computed flow using Equation 7.
The software also extrapolates a flow of 3,045 gpm at 20 psi and 3,346 gpm at 0 psi. In some cases, an additional hydrant needs to be flowed to obtain a measurable drop in the residual pressure. In that case, the data for the second flow hydrant is entered into the second row of the spreadsheet.

